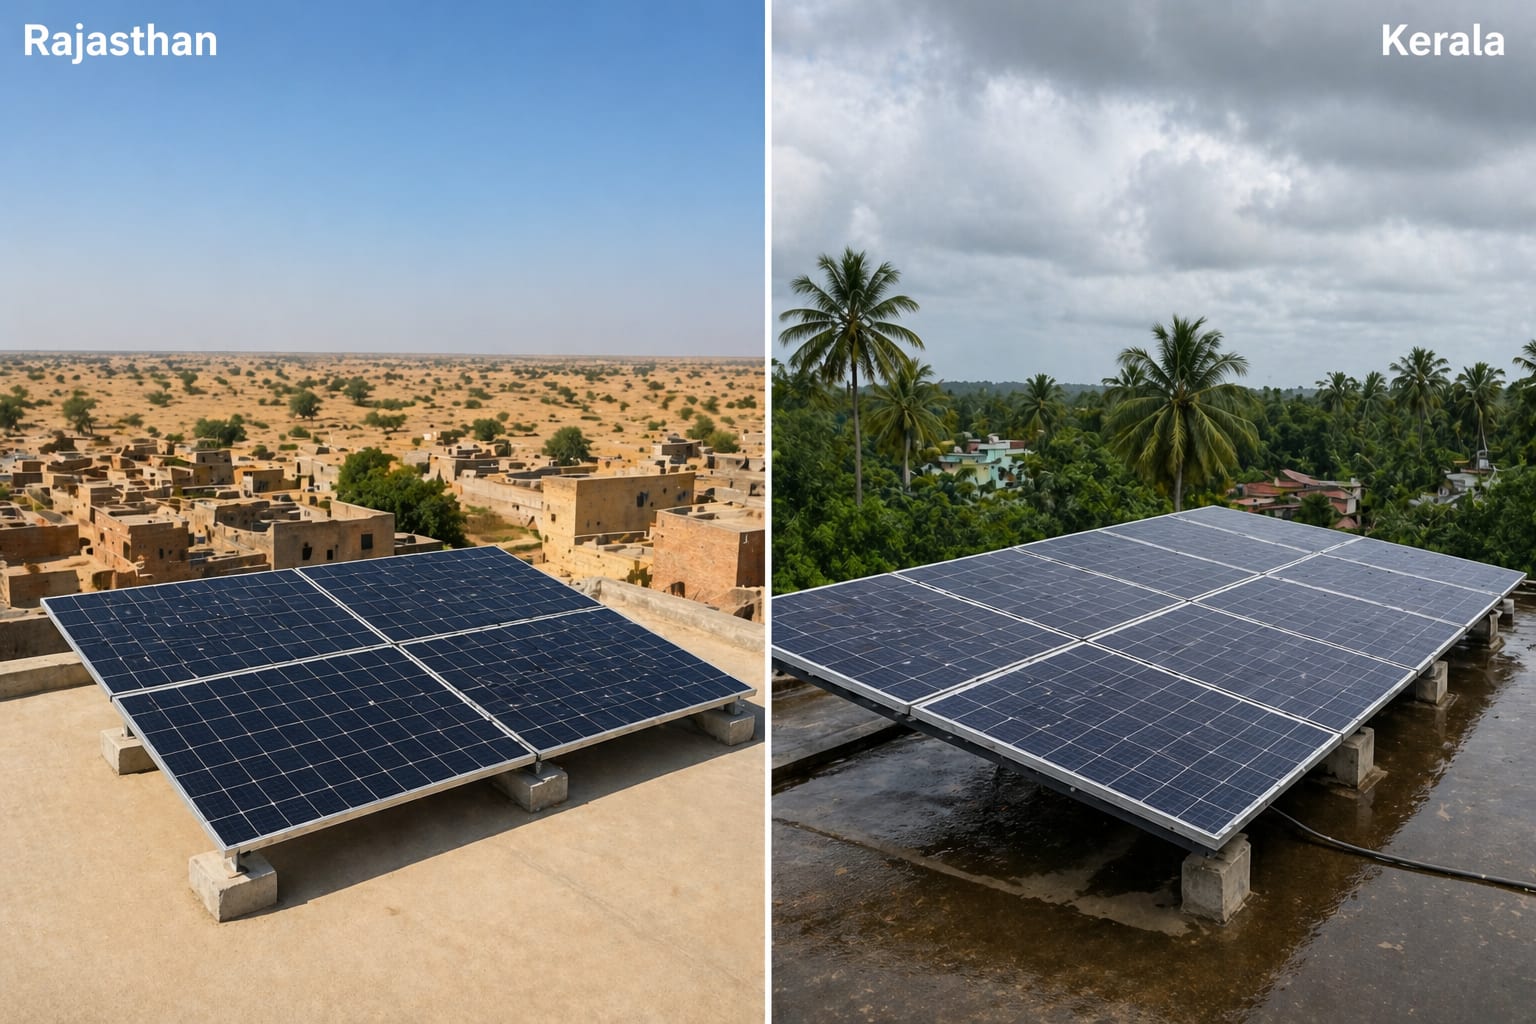
Rakesh from Jaipur and Suresh from Bangalore both installed identical 3 kW rooftop solar systems in January 2026—same panel brand, same inverter, same installation quality. Six months later, Rakesh's system generated 2,480 units while Suresh's generated 2,150 units. Why the 15% difference despite identical equipment? The answer lies in regional solar energy potential.
If you're planning rooftop solar installation, understanding your region's solar potential is crucial for realistic ROI expectations. North and South India have distinctly different climate patterns, sunshine availability, and generation potential. This comprehensive guide compares solar energy potential across India's northern and southern regions with data on peak sun hours, irradiation levels, generation capacity, seasonal variations, and actual ROI to help you make informed decisions.
Understanding Solar Energy Potential Across India
India spans diverse geographical and climatic zones, creating significant variations in solar energy potential from region to region.
What Determines Solar Energy Potential
Solar energy potential depends on several interconnected factors:
Solar irradiation: The amount of solar energy received per square meter per day, measured in kWh/m²/day. This is the fundamental measure of solar potential—higher irradiation means more energy available.
Peak sun hours: The number of hours per day when solar irradiation averages 1000 watts per square meter (equivalent to noon sunshine intensity). More peak sun hours equal more electricity generation.
Cloud cover: Cloudy days reduce solar generation by 50-80% depending on cloud density. Regions with fewer cloudy days have better solar potential.
Temperature: While counterintuitive, solar panels lose efficiency in extreme heat (about 0.3-0.5% per degree Celsius above 25°C). Moderate temperatures actually improve performance.
Air quality: Dust, pollution, and humidity reduce sunlight reaching panels. Cleaner air means better generation.
Latitude: Regions closer to the equator generally receive more consistent year-round sunshine. India's latitudinal spread from 8°N (Kanyakumari) to 35°N (Kashmir) creates variation.
Seasonal variation: Consistency of solar generation throughout the year matters. Regions with less seasonal fluctuation provide more predictable returns.
Regional Climate Patterns in India
North India (Punjab, Haryana, Delhi, Uttar Pradesh, Rajasthan, Madhya Pradesh, Bihar):
- Hot, dry summers (40-48°C)
- Cold winters with some regions below 5°C
- Low humidity except during brief monsoon
- Clear, sunny skies 8-9 months annually
- Monsoon concentrated in 2-3 months (July-September)
- High dust levels, especially in desert regions
- Significant pollution in Indo-Gangetic plains
South India (Karnataka, Tamil Nadu, Kerala, Andhra Pradesh, Telangana):
- Moderate temperatures year-round (25-38°C)
- High humidity, especially coastal areas
- Two monsoon periods (Southwest June-September, Northeast October-December)
- More consistent cloud cover throughout year
- Lower dust but higher humidity impact
- Coastal regions face salt corrosion issues
- Western Ghats create microclimates
These fundamental climate differences directly impact solar energy generation patterns.
Peak Sun Hours: North India vs South India
Peak sun hours are the best indicator of actual solar generation potential.
Northern Region Sunshine Data
Rajasthan (Jaipur, Jodhpur, Udaipur):
- Annual average: 6.5-7.0 peak sun hours per day
- Summer (March-June): 7.5-8.5 peak sun hours
- Monsoon (July-September): 4.0-5.0 peak sun hours
- Winter (October-February): 6.0-6.5 peak sun hours
- Annual sunshine days: 320-330 days
- Clear sky percentage: 75-80%
Punjab and Haryana (Chandigarh, Ludhiana, Amritsar):
- Annual average: 6.0-6.5 peak sun hours per day
- Summer: 7.0-8.0 peak sun hours
- Monsoon: 4.5-5.5 peak sun hours
- Winter: 5.0-5.5 peak sun hours (fog reduces morning generation)
- Annual sunshine days: 300-310 days
- Clear sky percentage: 70-75%
Delhi NCR:
- Annual average: 5.8-6.3 peak sun hours per day
- Summer: 7.0-8.0 peak sun hours
- Monsoon: 4.0-5.0 peak sun hours
- Winter: 4.5-5.0 peak sun hours (significant smog impact)
- Annual sunshine days: 290-300 days
- Clear sky percentage: 68-72%
Uttar Pradesh (Lucknow, Kanpur, Varanasi):
- Annual average: 5.5-6.0 peak sun hours per day
- Summer: 6.5-7.5 peak sun hours
- Monsoon: 3.5-4.5 peak sun hours
- Winter: 4.5-5.5 peak sun hours (fog issues)
- Annual sunshine days: 280-295 days
- Clear sky percentage: 65-70%
Southern Region Sunshine Data
Karnataka (Bangalore, Mysore, Hubli):
- Annual average: 5.5-6.0 peak sun hours per day
- Summer (March-May): 6.5-7.0 peak sun hours
- Southwest Monsoon (June-September): 4.0-4.5 peak sun hours
- Northeast Monsoon (October-November): 4.5-5.0 peak sun hours
- Winter (December-February): 5.5-6.0 peak sun hours
- Annual sunshine days: 270-285 days
- Clear sky percentage: 62-68%
Tamil Nadu (Chennai, Coimbatore, Madurai):
- Annual average: 5.3-5.8 peak sun hours per day
- Summer: 6.0-6.5 peak sun hours
- Southwest Monsoon: 4.5-5.0 peak sun hours (less impact)
- Northeast Monsoon: 3.5-4.0 peak sun hours (significant impact)
- Winter: 5.5-6.0 peak sun hours
- Annual sunshine days: 260-275 days (coastal areas lower)
- Clear sky percentage: 60-65%
Kerala (Kochi, Thiruvananthapuram, Kozhikode):
- Annual average: 4.8-5.3 peak sun hours per day
- Summer: 5.5-6.0 peak sun hours
- Southwest Monsoon: 3.0-3.5 peak sun hours (heavy impact)
- Northeast Monsoon: 4.0-4.5 peak sun hours
- Winter: 5.0-5.5 peak sun hours
- Annual sunshine days: 240-260 days
- Clear sky percentage: 55-60%
Andhra Pradesh and Telangana (Hyderabad, Visakhapatnam, Vijayawada):
- Annual average: 5.5-6.0 peak sun hours per day
- Summer: 6.5-7.0 peak sun hours
- Southwest Monsoon: 4.0-4.5 peak sun hours
- Northeast Monsoon: 4.5-5.0 peak sun hours
- Winter: 5.5-6.0 peak sun hours
- Annual sunshine days: 270-290 days
- Clear sky percentage: 63-68%
Seasonal Variations by Region
North India seasonal pattern:
- Sharp peak in summer (March-June) with maximum generation
- Significant drop during monsoon (July-September)
- Moderate generation in winter with fog/pollution impact
- High variability between seasons (50-60% difference between best and worst months)
South India seasonal pattern:
- More consistent generation throughout year
- Two monsoon dips but neither as severe as North's single monsoon
- Moderate, steady generation most months
- Lower variability between seasons (30-40% difference between best and worst months)
Key finding: North India gets 10-20% more peak sun hours annually but with greater seasonal fluctuation. South India has more predictable, consistent generation year-round.
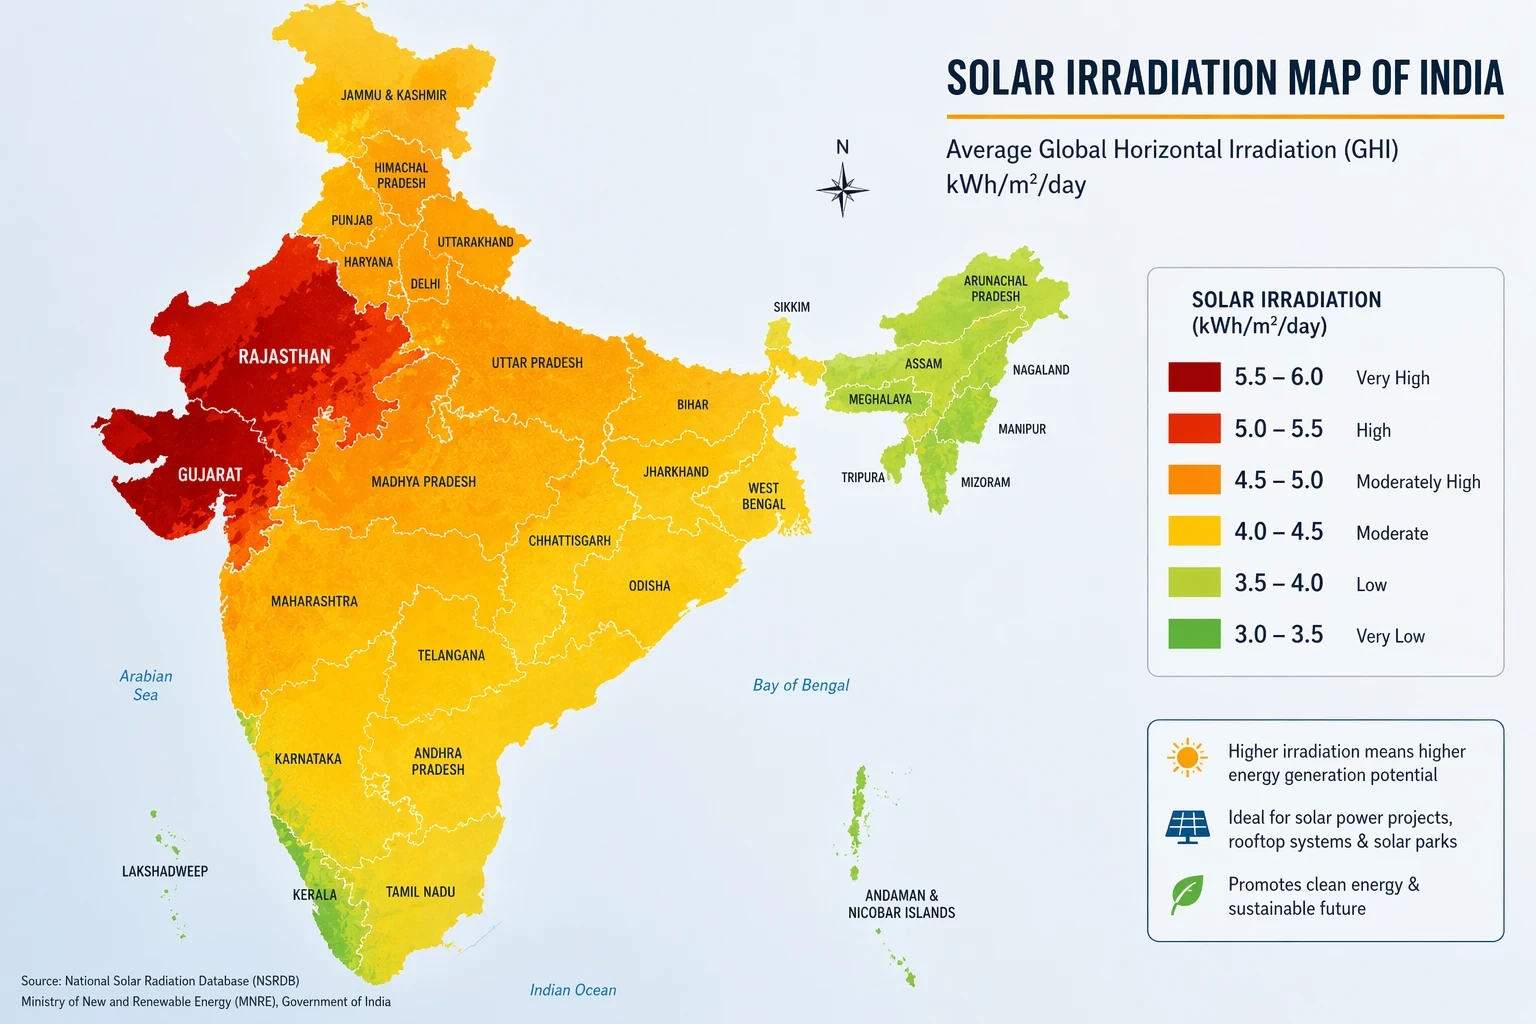
Solar Irradiation Levels Comparison
Solar irradiation data from National Institute of Solar Energy (NISE) and MNRE studies:
Annual Solar Irradiation North India
Rajasthan:
- Annual irradiation: 5.5-6.2 kWh/m²/day
- Total annual: 2,000-2,250 kWh/m²/year
- Highest in India due to desert climate
- Jodhpur and Jaisalmer reach 6.5 kWh/m²/day in summer
Punjab/Haryana:
- Annual irradiation: 5.2-5.8 kWh/m²/day
- Total annual: 1,900-2,100 kWh/m²/year
- Good potential but lower than Rajasthan
Delhi NCR:
- Annual irradiation: 5.0-5.6 kWh/m²/day
- Total annual: 1,825-2,050 kWh/m²/year
- Reduced by winter pollution
Uttar Pradesh:
- Annual irradiation: 4.8-5.4 kWh/m²/day
- Total annual: 1,750-1,970 kWh/m²/year
- Eastern UP lower than western UP
Annual Solar Irradiation South India
Karnataka (Interior):
- Annual irradiation: 5.0-5.6 kWh/m²/day
- Total annual: 1,825-2,050 kWh/m²/year
- Bangalore plateau region excellent
Tamil Nadu (Interior):
- Annual irradiation: 4.8-5.4 kWh/m²/day
- Total annual: 1,750-1,970 kWh/m²/year
- Coimbatore region good, coastal areas lower
Andhra Pradesh/Telangana:
- Annual irradiation: 5.0-5.6 kWh/m²/day
- Total annual: 1,825-2,050 kWh/m²/year
- Comparable to North-Central India
Kerala:
- Annual irradiation: 4.2-4.8 kWh/m²/day
- Total annual: 1,550-1,750 kWh/m²/year
- Lowest in India due to heavy monsoons and Western Ghats
Which Region Receives More Solar Energy
Winner: North India (specifically Rajasthan, parts of Gujarat)
Rajasthan receives 15-25% more annual solar irradiation than most South Indian states (except for interior Karnataka/AP/Telangana which are comparable).
However, the gap is smaller than many assume:
- Best North India locations: 5.5-6.2 kWh/m²/day
- Best South India locations: 5.0-5.6 kWh/m²/day
- Difference: 8-12% in most inhabited areas
Kerala is the outlier with 20-30% lower irradiation than Rajasthan, but interior Karnataka, Tamil Nadu, Andhra Pradesh, and Telangana are quite competitive with North-Central India.
Climate Factors Affecting Solar Performance
Raw irradiation numbers don't tell the complete story. Other climate factors significantly impact actual generation.
Temperature Impact on Panel Efficiency
The temperature paradox:
Solar panels work BETTER in moderate temperatures and WORSE in extreme heat. Each degree above 25°C reduces efficiency by 0.3-0.5% depending on panel quality.
North India summer impact:
Rajasthan rooftop temperatures: 65-75°C in May-June (panels reach 60-70°C)
Panel efficiency loss: 12-18% during peak summer afternoons compared to rated capacity
Example: A panel rated at 375W operates at effective 310-330W during Rajasthan summer peak heat
Mitigation: Proper mounting with 6-8 inch air gap helps, reducing temperature to 55-65°C and efficiency loss to 9-15%
South India temperature advantage:
Karnataka/Tamil Nadu rooftop temperatures: 45-55°C even in summer (panels reach 40-50°C)
Panel efficiency loss: 6-10% during warmest periods
Example: Same 375W panel operates at effective 340-355W in Bangalore summer
Annual impact:
North India's extreme summer heat partially offsets its higher irradiation advantage
South India's moderate temperatures maintain better efficiency year-round
Net result: Generation gap narrows from 15-20% (based on irradiation alone) to 10-15% (actual generation accounting for temperature)
Monsoon Patterns and Cloud Cover
North India monsoon (July-September):
- Concentrated in 2-3 months
- Heavy rainfall in short bursts
- Between rain spells, good generation continues
- 50-60% reduction in generation during monsoon months
- Rest of year largely unaffected
South India dual monsoons:
Southwest monsoon (June-September):
- Less intense than North India except Kerala
- Moderate impact on Karnataka, Andhra Pradesh, Telangana
- Severe impact on Kerala Western Ghats (70-80% reduction)
- 40-50% generation reduction most areas
Northeast monsoon (October-December):
- Affects Tamil Nadu, coastal Andhra, southern Karnataka
- 40-50% generation reduction during these months
- Double-dip effect means 4-6 months of reduced generation annually vs North's 2-3 months
Cloud cover throughout year:
North India: Clear skies 70-80% of year outside monsoon South India: More frequent cloud cover year-round, even outside monsoon (60-68% clear sky days)
This cloud pattern advantage significantly favors North India, particularly Rajasthan and Gujarat which have crystal-clear skies most of the year.
Dust and Air Quality Considerations
North India challenges:
Dust accumulation:
- Rajasthan, Gujarat: Heavy dust from Thar Desert
- Delhi NCR, UP, Bihar: Severe winter smog and pollution
- Punjab, Haryana: Agricultural burning smoke in October-November
Impact: Uncleaned panels lose 15-25% efficiency in 2-3 weeks during summer in Rajasthan
Cleaning frequency needed:
- Rajasthan/Gujarat: Every 2-3 weeks in summer
- Delhi NCR: Every 3-4 weeks year-round
- Punjab/Haryana: Monthly except during harvest burning season (weekly)
South India challenges:
Humidity and salt (coastal):
- Coastal Karnataka, Tamil Nadu, Kerala: Salt deposits from sea breeze
- All of South India: High humidity creates film on panels
Impact: Humidity film reduces efficiency by 5-10% even when panels appear clean
Cleaning frequency needed:
- Coastal areas: Every 3-4 weeks
- Interior Karnataka, Telangana: Every 4-6 weeks
- Less dust overall than North India
Advantage: South India, despite humidity issues, requires less frequent cleaning than North India's dust-prone regions. However, both regions need regular maintenance for optimal performance.
Electricity Generation Comparison
Real-world generation data from identical systems in different regions:
3kW System Output North vs South
Rajasthan (Jaipur) - 3 kW system:
- January-February: 320-350 units/month
- March-April: 400-430 units/month (peak)
- May-June: 410-440 units/month (peak, heat reduces efficiency slightly)
- July-September: 250-300 units/month (monsoon)
- October-December: 340-380 units/month
- Annual total: 4,300-4,600 units
Delhi NCR - 3 kW system:
- January-February: 280-310 units/month (smog impact)
- March-April: 370-400 units/month
- May-June: 390-420 units/month
- July-September: 240-280 units/month
- October-December: 300-340 units/month (pollution)
- Annual total: 3,900-4,200 units
Punjab (Ludhiana) - 3 kW system:
- January-February: 260-290 units/month (fog)
- March-April: 360-390 units/month
- May-June: 380-410 units/month
- July-September: 260-300 units/month
- October-December: 300-330 units/month
- Annual total: 3,800-4,100 units
Karnataka (Bangalore) - 3 kW system:
- January-February: 310-340 units/month
- March-May: 360-390 units/month
- June-September: 240-280 units/month (SW monsoon)
- October-November: 250-280 units/month (NE monsoon)
- December: 320-350 units/month
- Annual total: 3,700-4,000 units
Tamil Nadu (Chennai) - 3 kW system:
- January-February: 300-330 units/month
- March-May: 340-370 units/month
- June-September: 260-290 units/month
- October-December: 230-270 units/month (NE monsoon severe)
- Annual total: 3,500-3,800 units
Kerala (Kochi) - 3 kW system:
- January-February: 280-310 units/month
- March-May: 320-350 units/month
- June-September: 180-220 units/month (heavy monsoon)
- October-December: 240-280 units/month
- Annual total: 3,100-3,400 units
5kW System Output North vs South
Scale the 3 kW numbers proportionally (5/3 = 1.67x):
Annual generation 5 kW systems:
- Rajasthan: 7,200-7,700 units
- Delhi NCR: 6,500-7,000 units
- Punjab: 6,300-6,800 units
- Karnataka: 6,200-6,700 units
- Tamil Nadu: 5,800-6,300 units
- Kerala: 5,200-5,700 units
Annual Generation Estimates by Region
Ranking by annual generation (3 kW system):
- Rajasthan: 4,300-4,600 units (100% baseline)
- Gujarat (similar to Rajasthan): 4,200-4,500 units (98%)
- Delhi NCR: 3,900-4,200 units (91%)
- Punjab/Haryana: 3,800-4,100 units (89%)
- Andhra Pradesh/Telangana: 3,700-4,000 units (87%)
- Karnataka (Interior): 3,700-4,000 units (87%)
- Madhya Pradesh: 3,600-3,900 units (85%)
- Uttar Pradesh: 3,500-3,800 units (83%)
- Tamil Nadu (Interior): 3,500-3,800 units (83%)
- Tamil Nadu (Coastal): 3,300-3,600 units (78%)
- Kerala: 3,100-3,400 units (73%)
Key takeaway: The difference between best (Rajasthan) and good South Indian states (Karnataka, Andhra Pradesh) is only 10-15%, not the 30-40% many assume.
State-by-State Solar Potential Analysis
Best Northern States for Solar
Rajasthan - Overall Best in India:
- Highest solar irradiation: 5.5-6.2 kWh/m²/day
- Peak sun hours: 6.5-7.0 annually
- Clear skies 80% of year
- Challenges: Extreme heat, dust accumulation
- Ideal for: Maximum generation, desert regions especially good
- Government support: Strong, progressive net metering policies
- Rating: 10/10 for solar potential
Gujarat:
- Solar irradiation: 5.3-6.0 kWh/m²/day
- Peak sun hours: 6.3-6.8 annually
- Excellent sunshine, coastal areas slightly lower
- Challenges: Coastal salt corrosion, summer heat
- Government support: Excellent, additional state subsidies
- Rating: 9.5/10
Haryana/Punjab:
- Solar irradiation: 5.2-5.8 kWh/m²/day
- Peak sun hours: 6.0-6.5 annually
- Good potential, agricultural state benefits
- Challenges: Winter fog, crop burning smoke
- Government support: Good net metering policies
- Rating: 8.5/10
Delhi NCR:
- Solar irradiation: 5.0-5.6 kWh/m²/day
- Peak sun hours: 5.8-6.3 annually
- Good potential despite urban challenges
- Challenges: Air pollution, winter smog significantly impacts
- Government support: Excellent, fast net metering approvals
- Rating: 8/10
Madhya Pradesh:
- Solar irradiation: 5.0-5.5 kWh/m²/day
- Peak sun hours: 5.8-6.2 annually
- Solid potential across most of state
- Challenges: Regional variations, some areas with heavier monsoons
- Government support: Improving
- Rating: 7.5/10
Uttar Pradesh:
- Solar irradiation: 4.8-5.4 kWh/m²/day
- Peak sun hours: 5.5-6.0 annually
- Moderate potential, western UP better than eastern UP
- Challenges: Winter fog, pollution in many cities
- Government support: Improving but inconsistent
- Rating: 7/10
Best Southern States for Solar
Andhra Pradesh/Telangana - Best in South:
- Solar irradiation: 5.0-5.6 kWh/m²/day
- Peak sun hours: 5.5-6.0 annually
- Competitive with North-Central India
- Challenges: Dual monsoons but manageable
- Government support: Excellent, strong policy framework
- Rating: 8.5/10
Karnataka (Interior):
- Solar irradiation: 5.0-5.6 kWh/m²/day (Bangalore plateau)
- Peak sun hours: 5.5-6.0 annually
- Bangalore and surrounding areas excellent
- Challenges: Coastal areas lower, dual monsoons
- Government support: Very good, fast net metering
- Rating: 8.5/10
Tamil Nadu (Interior):
- Solar irradiation: 4.8-5.4 kWh/m²/day
- Peak sun hours: 5.3-5.8 annually (Coimbatore, Madurai)
- Interior regions good, coastal areas moderate
- Challenges: Northeast monsoon severe, Chennai/coastal lower generation
- Government support: Good policies
- Rating: 7.5/10 (interior), 6.5/10 (coastal)
Karnataka (Coastal):
- Solar irradiation: 4.5-5.0 kWh/m²/day
- Peak sun hours: 4.8-5.3 annually
- Moderate potential
- Challenges: Higher cloud cover, humidity, salt
- Rating: 7/10
Kerala:
- Solar irradiation: 4.2-4.8 kWh/m²/day
- Peak sun hours: 4.8-5.3 annually
- Lowest in South India due to heavy Western Ghats monsoons
- Challenges: Heavy rainfall 4-5 months, high humidity, frequent clouds
- Government support: Supportive but generation potential limited by geography
- Rating: 6/10
Regional pattern: Interior Deccan plateau states (Telangana, Karnataka, parts of Tamil Nadu) perform nearly as well as North-Central India. Coastal and Western Ghats regions have 15-25% lower potential.
Return on Investment by Region
ROI varies by region due to different generation capacities and electricity tariffs.
Payback Period in North India
Rajasthan (Jaipur) - 3 kW system:
- System cost: ₹1,55,000
- PM Surya Ghar subsidy: ₹78,000
- Net investment: ₹77,000
- Annual generation: 4,400 units
- JVVNL tariff: ₹7.50 average
- Annual savings: ₹33,000
- Payback: 2.3 years
- 25-year profit: ₹7,48,000
Delhi NCR - 3 kW system:
- System cost: ₹1,65,000
- PM Surya Ghar subsidy: ₹78,000
- Net investment: ₹87,000
- Annual generation: 4,000 units
- BSES tariff: ₹7.20 average
- Annual savings: ₹28,800
- Payback: 3.0 years
- 25-year profit: ₹6,33,000
Punjab (Ludhiana) - 3 kW system:
- System cost: ₹1,58,000
- PM Surya Ghar subsidy: ₹78,000
- Net investment: ₹80,000
- Annual generation: 3,950 units
- PSPCL tariff: ₹6.80 average
- Annual savings: ₹26,860
- Payback: 3.0 years
- 25-year profit: ₹5,91,500
Payback Period in South India
Karnataka (Bangalore) - 3 kW system:
- System cost: ₹1,62,000
- PM Surya Ghar subsidy: ₹78,000
- Net investment: ₹84,000
- Annual generation: 3,850 units
- BESCOM tariff: ₹7.10 average
- Annual savings: ₹27,335
- Payback: 3.1 years
- 25-year profit: ₹5,99,375
Tamil Nadu (Chennai) - 3 kW system:
- System cost: ₹1,60,000
- PM Surya Ghar subsidy: ₹78,000
- Net investment: ₹82,000
- Annual generation: 3,600 units
- TANGEDCO tariff: ₹6.50 average
- Annual savings: ₹23,400
- Payback: 3.5 years
- 25-year profit: ₹5,03,000
Andhra Pradesh (Hyderabad) - 3 kW system:
- System cost: ₹1,58,000
- PM Surya Ghar subsidy: ₹78,000
- Net investment: ₹80,000
- Annual generation: 3,850 units
- TSSPDCL tariff: ₹6.90 average
- Annual savings: ₹26,565
- Payback: 3.0 years
- 25-year profit: ₹5,84,125
Kerala (Kochi) - 3 kW system:
- System cost: ₹1,63,000
- PM Surya Ghar subsidy: ₹78,000
- Net investment: ₹85,000
- Annual generation: 3,250 units
- KSEB tariff: ₹6.20 average
- Annual savings: ₹20,150
- Payback: 4.2 years
- 25-year profit: ₹4,18,750
25-Year Profit Comparison
Ranking by total 25-year profit (3 kW system):
- Rajasthan: ₹7,48,000 (highest generation + good tariff)
- Gujarat: ₹7,20,000
- Delhi NCR: ₹6,33,000 (good generation + high tariff)
- Punjab: ₹5,91,500
- Karnataka: ₹5,99,375
- Andhra Pradesh/Telangana: ₹5,84,125
- Tamil Nadu (Interior): ₹5,50,000
- Tamil Nadu (Coastal): ₹5,03,000
- Kerala: ₹4,18,750
Key insight: While North India (especially Rajasthan/Gujarat) leads in absolute profit, the difference with good South Indian states (Karnataka, Andhra Pradesh) is only 20-25%, not dramatic. All regions provide excellent ROI with payback under 4.5 years.
Higher electricity tariffs in some North Indian states (Delhi, Rajasthan) amplify the generation advantage, creating wider ROI gaps than generation alone would suggest.
Regional Challenges and Advantages
North India Solar Installation Challenges
Extreme temperature swings:
- Summer 45-48°C, winter 2-5°C in Delhi/Punjab
- Thermal expansion/contraction stress on mounting structures
- Requires quality mounting hardware and expansion joints
- Premium panels with better temperature coefficients essential
Air quality issues:
- Delhi NCR winter smog reduces generation 15-20% for 2-3 months
- Requires frequent cleaning (monthly minimum)
- Pollution film even on "clean" panels
- Annual maintenance costs ₹3,000-5,000 higher than South India
Dust accumulation:
- Rajasthan/Gujarat desert dust severe
- Cleaning every 2-3 weeks essential in summer
- Efficiency loss of 20-30% if not maintained
- Hydrophobic coating recommended (₹3,000-5,000 extra)
Fog impact (Punjab, Haryana, UP):
- Winter morning fog delays generation start by 2-4 hours
- Particularly severe December-January
- 10-15% winter generation loss
- No mitigation possible, inherent climate challenge
Advantages:
- Highest solar irradiation in India (Rajasthan, Gujarat)
- Long summer days with 8-9 peak sun hours
- Crystal clear skies 8-9 months
- Strong government support and installer availability
- Competitive installation costs
- Faster payback despite challenges
South India Solar Installation Challenges
Dual monsoon impact:
- Two separate monsoon periods reduce generation 4-6 months annually
- Less predictable generation patterns
- Requires larger battery backup if going hybrid
- Net metering banking essential to compensate
High humidity:
- Creates film on panels even between rains
- Reduces efficiency 5-10% in coastal areas
- Accelerates component degradation if not quality products
- Requires corrosion-resistant mounting structures
Coastal corrosion (Karnataka, Tamil Nadu, Kerala coasts):
- Salt spray from sea corrodes mounting structures
- Electrical connections vulnerable
- Requires stainless steel or aluminum mounting only
- Higher long-term maintenance costs
Western Ghats cloud cover (Kerala):
- Frequent cloud cover even outside monsoon
- 20-30% lower generation than interior regions
- Makes solar less economically viable
- Longer payback periods
Less installer competition:
- Fewer MNRE-empaneled installers in smaller cities
- Installation costs 5-8% higher than North India in some areas
- Service response slower in remote locations
Advantages:
- Moderate temperatures maintain panel efficiency year-round
- No extreme winter challenges (fog, smog)
- Less dust = lower maintenance frequency
- More consistent generation (lower seasonal variation)
- Excellent government support in Karnataka, Andhra Pradesh
- Growing installer presence in major cities
Government Support and Infrastructure
Net Metering Policies by Region
North India:
Rajasthan: Excellent - 90-day banking, annual settlement, fast approvals (10-15 days), progressive policies
Gujarat: Excellent - Similar to Rajasthan, strong government push for solar
Delhi: Very Good - 15-day approval target, well-streamlined process, consumer-friendly policies
Punjab/Haryana: Good - 20-25 day approvals, decent policies but some DISCOM delays
UP: Moderate - Improving but inconsistent across DISCOMs, 25-40 day approvals
South India:
Karnataka: Excellent - 90-day banking, 15-day approval target, very progressive
Andhra Pradesh/Telangana: Excellent - Strong policy framework, supportive DISCOMs
Tamil Nadu: Good - Reasonable policies, approval times 20-30 days
Kerala: Good - Supportive despite lower generation potential, KSEB cooperative
Verdict: Both regions have strong government support. Karnataka and Andhra Pradesh match or exceed North Indian states in policy quality.
State Subsidies Comparison
Beyond PM Surya Ghar's ₹78,000 central subsidy:
Additional North India subsidies:
- Gujarat: ₹10,000 extra per kW for farmers/rural areas
- Rajasthan: 30% additional for SC/ST households (₹15,000-20,000)
- Haryana: Priority processing, expedited approvals
- Punjab: Generation-based incentive ₹1.50/unit for 3 years
Additional South India subsidies:
- Karnataka: Property tax rebates, fast-track approvals
- Andhra Pradesh: Additional benefits for agricultural connections
- Tamil Nadu: Generation incentives in some districts
- Kerala: Focus on community solar projects
Verdict: Gujarat and Rajasthan offer most generous additional subsidies. South Indian states focus more on process improvements than additional cash subsidies.
Which Region is Better for Your Solar Investment
Choose North India (Rajasthan, Gujarat, Haryana) if:
- You want maximum electricity generation
- You're comfortable with higher maintenance frequency
- Your location has reliable cleaning services available
- You want fastest payback period
- Summer heat is not a concern (RCC roofs common)
- You can tolerate seasonal generation variability
Choose South India (Karnataka, Andhra Pradesh, Telangana) if:
- You value consistent year-round generation
- You prefer lower maintenance requirements
- You want moderate temperatures for better panel longevity
- You're in interior regions (not heavy monsoon zones)
- You prefer predictable monthly generation
- Slightly longer payback (3-3.5 years vs 2.5-3 years) is acceptable
Avoid or reconsider solar in:
- Kerala Western Ghats regions (generation 25-30% lower)
- Heavy smog zones of Delhi NCR if you cannot maintain monthly cleaning
- Extreme fog zones of Eastern UP/Bihar (winter generation severely impacted)
- Coastal regions unless you use marine-grade mounting structures
Bottom line: Both North and South India (except Kerala/coastal) offer excellent solar potential with 2-4 year payback periods. North India has 10-20% higher generation but requires more maintenance. South India's moderate climate and consistent generation make it nearly as attractive. Choose based on your local conditions, not regional stereotypes.
The best solar decision is to install regardless of region—even "low-potential" Kerala provides 4-year payback, which beats almost any other home investment.
Conclusion
Solar energy potential in North India is 10-20% higher than South India on average, with Rajasthan leading at 4,300-4,600 annual units from a 3 kW system compared to Karnataka's 3,700-4,000 units. However, this advantage is partially offset by North India's extreme temperatures, heavy dust, and winter pollution requiring more maintenance. Interior South Indian states like Karnataka, Andhra Pradesh, and Telangana perform nearly as well as North-Central India with more consistent year-round generation.
Both regions offer excellent ROI with payback periods of 2-4 years and 25-year profits of ₹4-7 lakh from a 3 kW system. The choice between regions matters less than choosing quality components, proper installation, and regular maintenance. Whether you're in Jaipur or Bangalore, rooftop solar is one of the best home investments in 2026.
Ready to go solar? Get quotes from MNRE-empaneled installers in your region, apply for the ₹78,000 PM Surya Ghar subsidy at pmsuryaghar.gov.in, and start generating free electricity from India's abundant sunshine—North or South, your solar investment will pay off handsomely.


